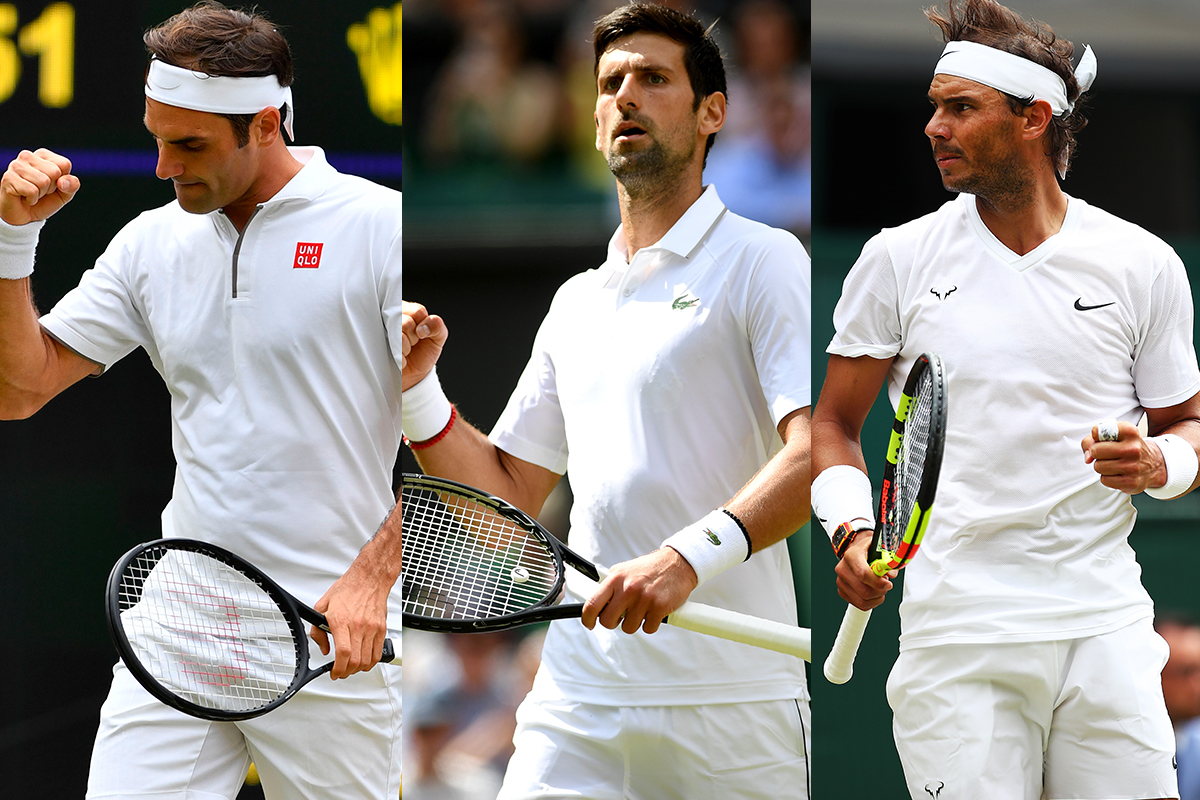
In this project, I explore professional men's tennis and how the stats that define champions have evolved over the last 20 years.
This end to end project includes the data collection and engineering in SQL, analysis in Python and visualisation in Tableau.
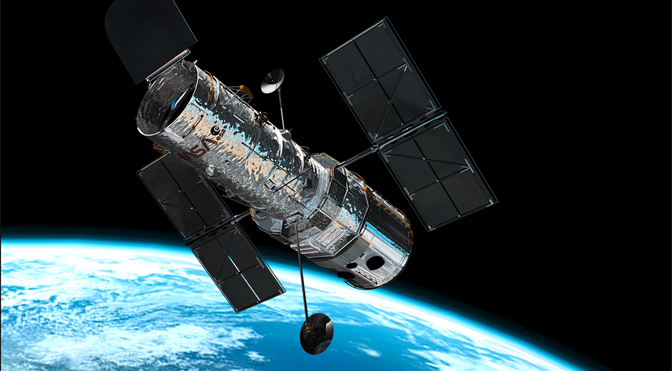
This project demonstrates the use of Python to manipulate, analyse and visualise complex astronomical data. Includes a BPT-diagram, made using real data from the Hubble Space Telescope
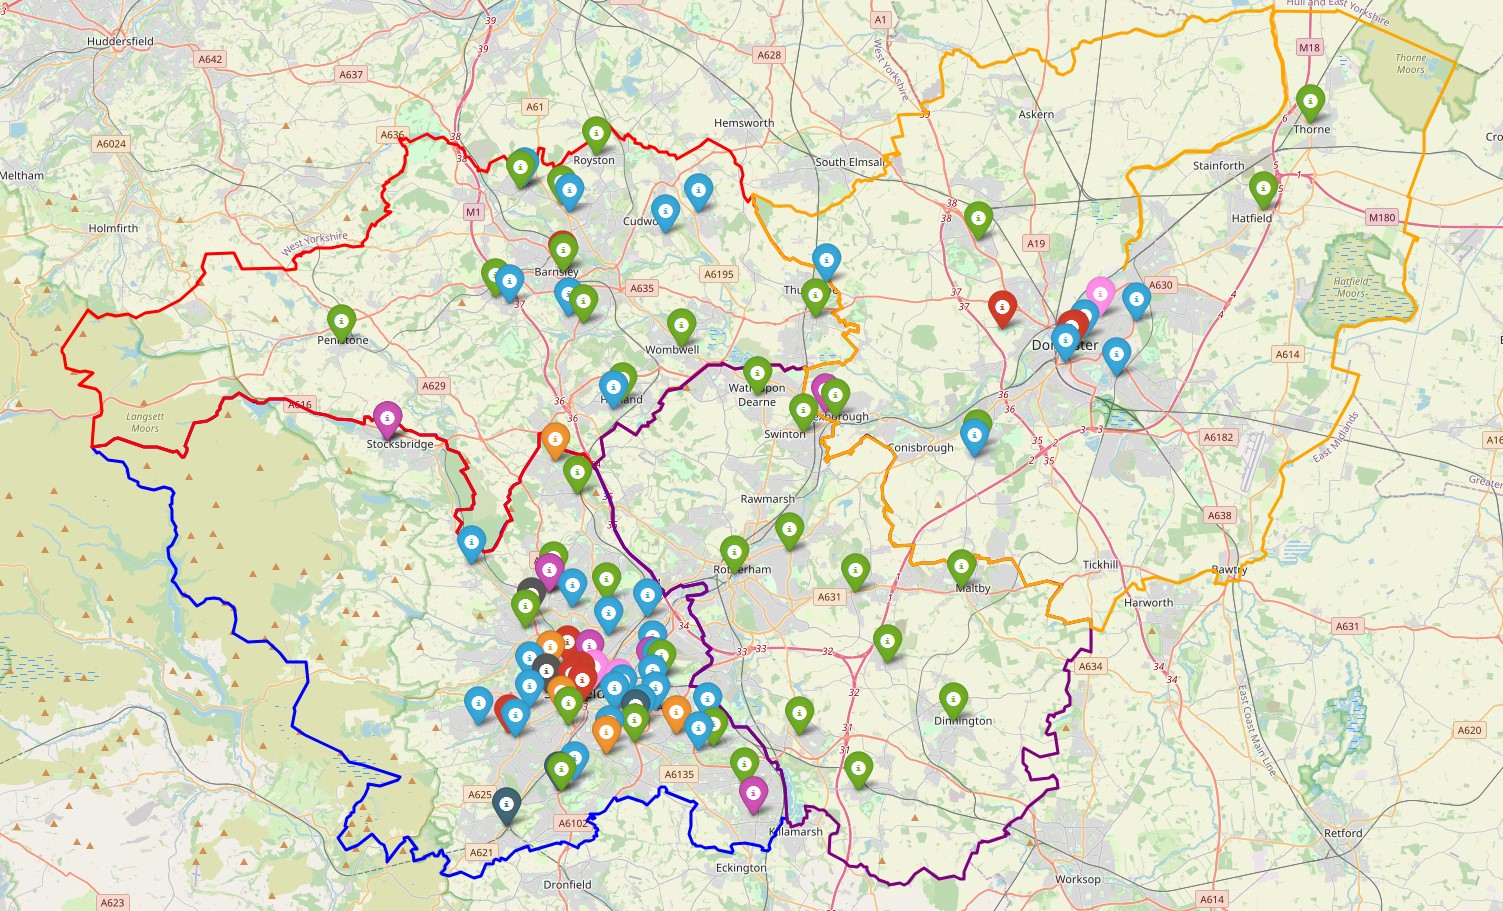
In this project, Python was used to geocode the locations of venues used by Concerteenies, an early years music charity. Python was then used to develop an interactive map to visualise the venue locations across South Yorkshire.

This contains all my public Tableau dashboards, including a dashboard visualising my performance in various competitive tennis matches.

A detailed overview of my education, technical skills, and professional experience in data analytics and physics.